

Stop wasting hours on manual data entry. Discover the secrets to building a high-impact commercial real estate comp sheet that wins clients and closes deals faster.
How to Create a Commercial Real Estate Comp Sheet
Deals live and die by speed. Commercial real estate brokers and investors analyze dozens of properties every week. You lose deals when your valuation process takes too long. Conversely, fast analysis without accuracy leads to bad investment choices.
A commercial real estate comp sheet solves this exact problem. It gives you a clear snapshot of recent sales and lease data in your market. Brokers use comp sheets to price listings accurately. Investors use them to make data-driven investment decisions.
Real estate professionals spend up to ten hours every week building manual comparison tables. That lost time costs money. Building a tight, clean comp sheet helps you spot market trends quickly. Also, it accelerates your property valuation analysis and keeps your firm competitive.
What Exactly Should Be in a Commercial Real Estate Comp Sheet?
A good comp sheet groups critical metrics into structured rows and columns. You need consistent data points to evaluate properties fairly. Missing fields create blind spots during property valuation analysis.
Essential Comp Sheet Data Fields
Every professional comparison sheet must include specific property criteria:
| Data Category | Specific Metrics to Include | Purpose in Valuation |
|---|---|---|
| Property Identifiers | Address, Property Type, Submarket, Year Built | Establishes baseline physical asset details |
| Transaction Data | Sale Price, Sale Date, Buyer/Seller Names | Shows actual market velocity and real value |
| Size Metrics | Total Square Feet (SF), Lot Size, Occupancy % | Allows apples-to-apples spatial comparison |
| Financial Metrics | Price per SF, NOI, Cap Rate, Lease Rate/SF | Direct input for financial yield modeling |
Key Metrics Explained
- Cap Rate (Capitalization Rate): Calculates annual net operating income divided by purchase price.
- Price per Square Foot ($/SF): Standardizes asset prices across different property sizes.
- Lease Rate: Shows current income per square foot, listed as gross or triple net (NNN).
The Traditional vs. Modern Approach: Why Manual Copy-Pasting is Killing Your Productivity
Brokers traditionally copy property data from websites directly into Excel spreadsheets. You open five browser tabs, highlight numbers, and switch screens repeatedly. This workflow slows down your entire team.
The Cost of Manual Workflows
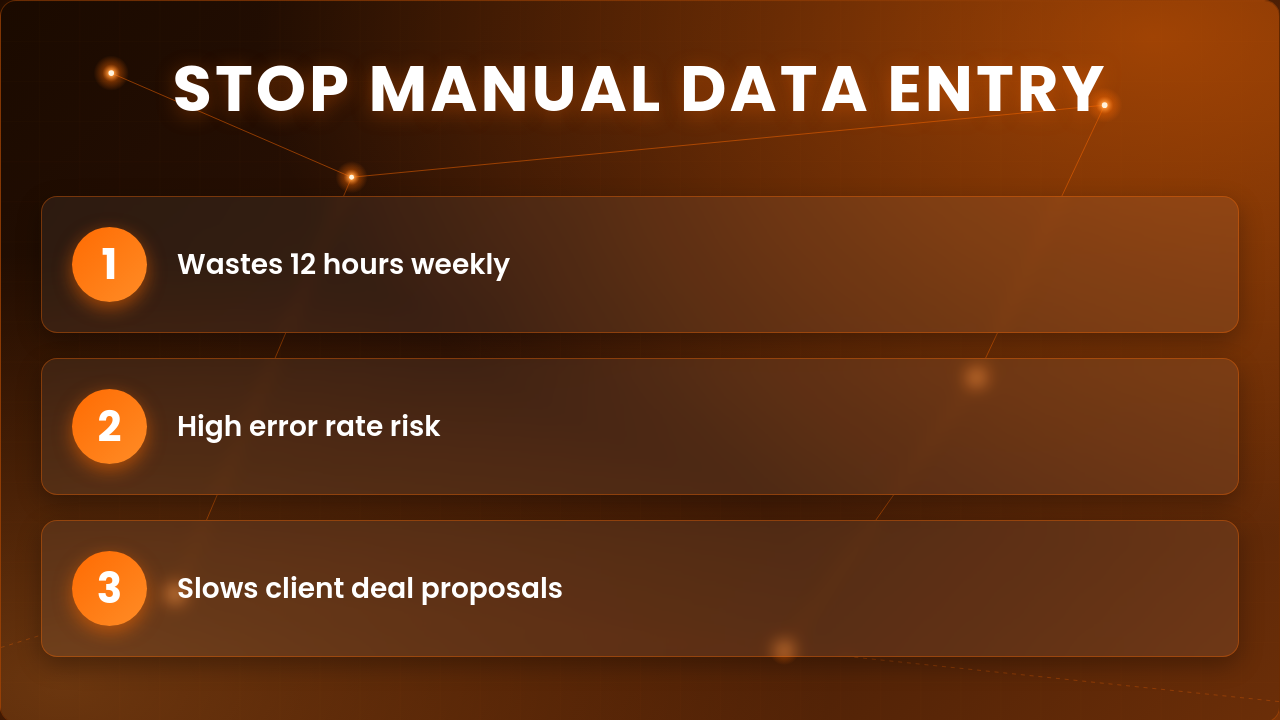
Manual data entry wastes valuable hours every week. Human errors happen when you manually type numbers into spreadsheets. As a result, a single wrong decimal point distorts your entire financial model.
- Brokers lose up to 12 hours weekly on manual data entry.
- Manual spreadsheets contain errors in over 15% of records.
- Slow comp generation delays client proposals by several days.
Modern CRE teams rely on digital CRE workflow optimization tools instead. Automated workflows pull active listings and historical sales records in seconds. Therefore, you eliminate typos and present accurate numbers to clients faster.
Upgrade Your Workflow Today
Stop wasting hours on manual data entry. Use PropQwik to automate your analysis and close deals faster than ever.


Step-by-Step: How to Build Your Comp Sheet from Scratch
Creating a structured comp sheet requires a simple four-step process.
Step 1: Define Your Target Criteria
Set boundaries for your comp search before collecting data. Filter comps by property type, geographic radius, building class, and sale timeframe (typically 6–12 months).
Step 2: Source Reliable Property Data
Pull property records from multiple credible platforms. Next, check public tax records, MLS feeds, and commercial broker listings to verify sale prices.
Step 3: Standardize Your Financial Variables
Convert all figures into matching units. For example, convert annual lease rates to monthly figures if necessary. Ensure gross leases convert accurately to NNN terms.
Step 4: Calculate Averages and Market Adjustments
Calculate median values for price per square foot and cap rates across your dataset. Finally, adjust values up or down for older buildings, deferred maintenance, or vacant space.
Free Resource: Download Our Professional CRE Comps Template
Stop building spreadsheets from scratch every single time. A pre-built layout helps you maintain consistency across all client presentations. You can start by using our free professional CRE templates to get a head start.
What Our Free Template Includes
Our pre-formatted spreadsheet offers built-in formulas for immediate use:
- Auto-calculating Cap Rates, NOI, and Price/SF fields.
- Clean layout formatted for client PDF exports.
- Side-by-side comparison tables for retail, office, and industrial properties.
Use this layout to speed up your deal analysis immediately.
How to Leverage PropQwik to Automate Your Comp Sheet Process
Manual copying slows your progress. PropQwik speeds up your commercial real estate work through smart browser tools.
One-Click Data Extraction with the PropQwik Chrome Extension
The PropQwik Chrome extension pulls property data directly from major listing websites. You click once on an active listing, and PropQwik grabs the price, square footage, building age, and listing broker details. The system drops this information straight into your custom spreadsheet without tab switching.
Fast Presentation Creation via Gamma AI
Data extraction is only half the job. You also need to share comps with clients clearly. PropQwik integrates directly with Gamma AI. This feature converts raw comp tables into polished, interactive presentation decks automatically.
- Speed: Extract listings in seconds via the Chrome Extension.
- Accuracy: Eliminate copy-paste errors across financial fields.
- Presentation: Export clean client decks using Gamma AI integration.
Automating your CRE workflow optimization allows your team to focus on closing deals rather than formatting tables.
Best Practices for Professional Presentation
Clients evaluate your professionalism based on your reports. A messy layout damages your credibility, even if your underlying numbers are correct.
Design Tips for Client-Ready Reports
- Use Visual Hierarchy: Make property addresses and final averages bold.
- Limit Color Palettes: Use two professional primary colors max.
- Include Property Imagery: Add small exterior photos for quick visual recognition.
- Add Summary Charts: Insert simple bar graphs comparing price per square foot across comps.
Clean formatting turns complex data into clear stories. Consequently, clients make data-driven investment decisions quickly when data is easy to read.
Scaling Your CRE Workflow with Technology
Speed and data accuracy win deals in commercial real estate. Building manual comp sheets in Excel wastes valuable hours every week. Modern technology lets you work smarter and deliver better reports. Consider utilizing workflow automation to scale your business and close deals faster.
Adopting automated tools streamlines your property valuation analysis. You extract listing data instantly, run clean financial comparisons, and generate branded presentation decks within minutes. Standardize your process today to scale your business and close deals faster.
Frequently Asked Questions About CRE Comp Sheets
1. What is a commercial real estate comp sheet?
A: A commercial real estate comp sheet is a comparative analysis table. It compares similar recent property sales or leases to determine the fair market value of a target property.
2. How many comps should you include in a CRE comp sheet?
A: Include 3 to 5 recent, highly relevant comps for a standard valuation. Include 8 to 10 comps for complex assets or volatile markets to establish a reliable average range.
3. How far back should commercial real estate sales comps go?
A: Focus on transactions completed within the last 6 to 12 months. Expand your search to 18 or 24 months only if few local comps exist.
4. Are automated data extraction tools safe for proprietary client data?
A: Yes, secure data tools like PropQwik protect your property lists. The Chrome extension processes listing data securely through private user sessions without sharing confidential client records.
5. How does PropQwik extract CRE data from online listings?
A: PropQwik uses a Chrome extension to read property fields on active web pages. It formats price, cap rates, and building specs into your spreadsheet instantly.
6. What is the difference between sales comps and lease comps?
A: Sales comps track historical property purchase prices and cap rates. Lease comps record rental rates, lease terms, tenant improvement allowances, and lease structures like NNN or Gross.