

See how PropQwik transformed an investment analyst's workflow, enabling them to generate a comprehensive, visually stunning board presentation from a new listing in just one day. This is the ultimate time savings case study for CRE professionals.
The Board Meeting is Tomorrow! (And You Just Found the Perfect Property)
The world of commercial real estate moves fast. Deadlines arrive without warning. One day, you uncover a prime property. The next, you need to present it to your executive board. This scenario is common for investment analysts. They often discover a promising asset but then face an impossible deadline for internal approval. It demands a fast turnaround.
Imagine the challenge: moving from raw listing data to a full board-ready presentation in a single day. Many believe this is simply not possible. This *analyst case study PropQwik* shows how one person turned immense pressure into remarkable productivity. It reveals a new way to work, proving that speed and accuracy can go hand-in-hand in CRE.
The Traditional Treadmill: An Analyst's Pre-PropQwik Reality
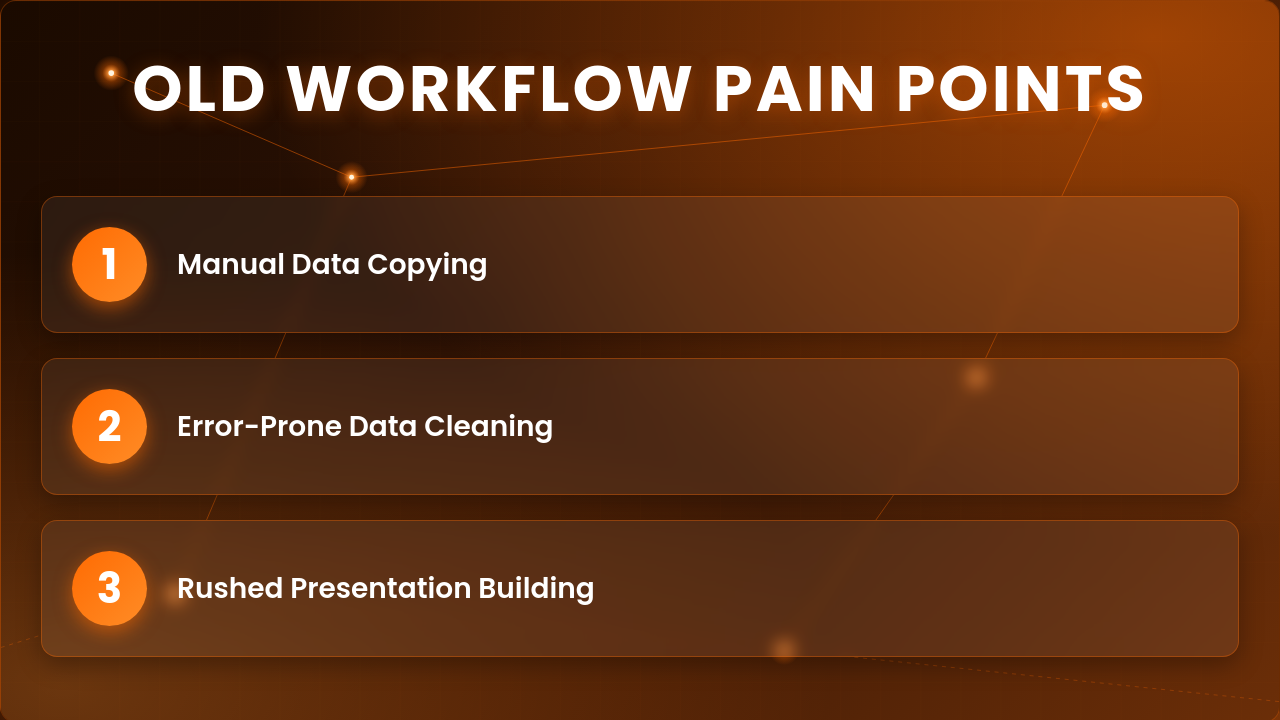
Before modern tools, an analyst's workflow was slow and repetitive. Finding new properties was only the first step. The real work began after that.
- The Data Dilemma: Analysts spent hours. They manually copied vital property details. This included addresses, prices, lease rates, broker contacts, and listing images. Data came from many CRE portals like LoopNet.
- The Spreadsheet Struggle: After copying, data needed cleaning. Analysts formatted and standardized it. They moved it into usable spreadsheets. This was a painstaking process, prone to errors.
- The Presentation Purgatory: Creating compelling "visual slides" took a lot of time. Analysts often started from scratch. Rushed timelines meant sacrificing quality or personal time. This caused stress and led to potential mistakes.
This old way of working carried significant opportunity costs. It was a clear *time savings case* waiting for a solution. Analysts spent hours on low-value tasks. They had less time for true analysis and strategic thinking.
Meet Sarah: A Race Against the Clock with PropQwik
Sarah works as a senior investment analyst. Her firm is a small, specialized commercial real estate company. Today, she faces a critical deadline. Her executive board meeting is set for tomorrow morning at 9 AM. She just found a newly listed industrial property. It looks like an excellent opportunity.
Her mission is clear:
- Evaluate the property listing.
- Conduct initial due diligence.
- Prepare a complete, convincing presentation.
She must do all of this before the morning meeting. The stakes are high for Sarah. She needs to impress the board. Her presentation must secure pre-approval for a deeper look at the deal. A successful outcome means moving forward on a potentially very profitable acquisition.
PropQwik in Action: Unprecedented Speed and Accuracy
PropQwik changed Sarah's day completely. It provided the tools she needed to meet her deadline.
Step 1: One-Click Data Extraction – The Instant Advantage
Sarah found the promising industrial property listing on LoopNet. She clicked on the PropQwik Chrome extension. All essential data instantly appeared. This included the address, price, and broker details. Key financial metrics, like an initial *cap rate example*, also appeared. All available listing images were there too. PropQwik captured everything in one go.
PropQwik worked in the background. It let Sarah move between tabs. She could multitask efficiently while the data gathered. This feature was crucial. This seamless process shows the core of the *analyst case study PropQwik* in action.
Step 2: Streamlined Analysis with Google Sheets Sync (Connectivity Add-on)
Sarah no longer entered data manually. PropQwik’s Google Sheets sync saved her hours. This feature comes with the Connectivity add-on. It automatically filled a pre-designed spreadsheet template. Sarah had her data instantly ready. This made financial modeling and comparative analysis much faster.
She added her first property notes within PropQwik. She included potential deal risks. Preliminary valuation insights were also noted. PropQwik's tracking features kept everything organized. This helped her prepare for the board’s questions.
Step 3: Crafting Compelling Visuals: Raw Data to 'Visual Slides' in Seconds
Sarah used PropQwik's professional PowerPoint generation. This feature uses Gamma AI. She chose her preferred board presentation template. With another click, her extracted data and images became a polished deck. It was visually appealing and ready for the board.
The presentation clearly showed the *cap rate example*. IRR projections and other important financial figures were professionally arranged. These impactful *visual slides* looked thorough. PropQwik also auto-saved the presentation to Google Drive. This created an instant backup. She could share it easily with her team for quick review and final approval.
The Unbelievable Outcome: A True 'Time Savings Case' for the Books
The difference PropQwik made for Sarah was dramatic.
- Before PropQwik: Sarah would have spent 4 to 6 hours. This time would go into data entry, formatting, and presentation design. This often meant late nights, more stress, and rushed analysis.
- With PropQwik: Sarah finished the whole process in just a few efficient hours. She went from finding the listing to having a complete, professional board presentation. It was error-free.
This is a clear *time savings case*. She saw an estimated 70-80% reduction in manual, repetitive tasks. PropQwik gave her back crucial hours. This extra time allowed her to do in-depth analysis. She focused on strategic property evaluation. Sarah even left the office at a reasonable hour. She felt confident about her presentation the next morning.
Sarah's Board Presentation: A Resounding Success
The next morning, Sarah presented her findings. The polished, data-rich *visual slides* immediately caught the board's attention. They held it throughout her presentation. The clear *cap rate example*, detailed financial projections, and high-quality images were easy to understand. They showed a thorough investigation.
Sarah spoke with confidence. Accurate, impeccably presented data supported every point. She answered questions easily. The board members were impressed by the speed and quality of her work. They approved further due diligence. Sarah's reputation as a highly efficient and valuable analyst grew stronger.
Beyond Sarah: Who Else Can Experience This Transformation?
Sarah's story shows the power of smart tools. Many other professionals can benefit from PropQwik.
- Commercial brokers can close more deals. They create faster, more polished client proposals.
- Real estate developers swiftly evaluate new sites. They get quick financial overviews.
- Property managers streamline portfolio reviews. They easily track property performance.
- Brokerage teams improve teamwork. Everyone shares consistent, accurate data.
The need for efficiency, accuracy, and professional presentation is universal in commercial real estate. PropQwik addresses this need across the industry.


Ready to Reclaim Your Time? Start Your PropQwik Journey Today!
Are you tired of manual data entry? Do you want to present properties faster?
- Your 7-Day Free Trial Awaits: Test PropQwik with no commitment or risk. See how it changes your workflow.
- Choose Your Plan: Pick a plan that fits your needs. The Starter plan is $19.99/month. The Pro plan is $39.99/month. Both are designed for your monthly extraction needs.
- Add Connectivity: Get the Connectivity add-on for $10/month. It offers full integration with Google Sheets sync and Google Drive auto-save.
- Stop Copying, Start Closing: Shift your focus from repetitive tasks. Spend more time on high-value activities that drive deals and grow your business.
FAQs About PropQwik and CRE Workflow Efficiency
- Q1: How does PropQwik improve data accuracy for CRE analysts?
PropQwik extracts data directly from listings. This process reduces human error from manual copying. It ensures that critical details like prices and cap rates are precise.
- Q2: Can PropQwik really help create a board presentation in a single day?
Yes, PropQwik automates data collection and presentation building. This significantly cuts down the time spent on these tasks. Analysts can then focus on analysis and strategy.
- Q3: What types of property data can PropQwik extract?
PropQwik captures key property details. This includes address, price, lease rates, broker contact, financial metrics (like initial cap rates), and all available listing images.
- Q4: Is PropQwik compatible with common CRE portals like LoopNet?
Yes, PropQwik uses a Chrome extension. It works seamlessly with popular commercial real estate listing sites, including LoopNet.
- Q5: How does the Google Sheets Sync feature benefit an investment analyst?
The Google Sheets Sync saves analysts from manual data entry. It populates a structured spreadsheet template instantly. This makes financial modeling and comparative analysis much faster and more organized.
- Q6: What is a "cap rate example" in real estate and why is it important in presentations?
A cap rate (capitalization rate) is a ratio. It helps estimate the potential return on an investment property. For example, a property priced at $1,000,000 with a net operating income of $70,000 has a cap rate of 7%. It’s crucial in presentations to quickly show a property's income-generating ability relative to its cost.
- Q7: How does PropQwik help in making "visual slides" more professional?
PropQwik uses Gamma AI to generate professional PowerPoint presentations. It takes extracted data and images and formats them into clean, visually appealing slides. This ensures a consistent and high-quality look.
- Q8: What is the main "time savings case" benefit for using PropQwik?
The primary benefit is a significant reduction in time spent on manual data entry and presentation creation. Users often report 70-80% less time on these repetitive tasks, freeing them for higher-value work.
- Q9: Can PropQwik be used by teams, or is it better for individual analysts?
PropQwik works well for both. Individual analysts gain efficiency. Teams benefit from consistent data, shared templates, and automatic cloud saves for better collaboration.
- Q10: What does the Connectivity add-on include?
The Connectivity add-on provides Google Sheets sync for automated data transfer. It also offers Google Drive auto-save for presentations. This means better integration with common cloud workflows.
Conclusion: PropQwik – The Future of CRE Workflow Efficiency
PropQwik changes how commercial real estate professionals work. It especially helps investment analysts. The tool allows them to achieve more in less time. They get higher accuracy and create professional outputs. PropQwik offers significant time savings. It removes workflow friction. It helps produce excellent materials. You gain peace of mind knowing your data is precise and ready. PropQwik is the essential tool for today's commercial real estate professional.